My Data Workflow
In this post, I outline my basic workflow while working with primary data (quantitative for the most part). Parts of the workflow would be similar for working with secondary data as well.
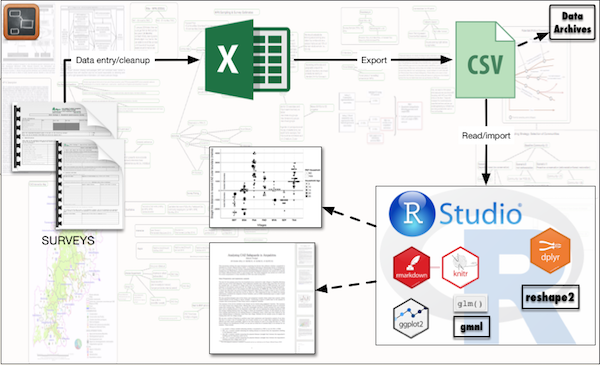
First of all, I use Scapple as a tool to organise my thoughts, brainstorm, and plan my work (background on the figure above).
Most of the data I work with comes from structured surveys. The original raw data is usually entered and cleaned in Excel - primarily because virtually everybody knows how to work with Excel. Once the data is cleaned and ready to be analysed, I export them to .csv format. If the data is also going to be deposited in public data archives .csv is one of the most commonly accepted formats. I then import the data into R for analysis and visualisation. I use RStudio as the main work environment, for data organising and manipulation (using packages like dplyr and reshape2), for analysis and visualisation (packages like gmnl and ggplot2 - also see my other post about my favourite visualisation packages), and also for initial drafts of my reports/papers (using rmarkdown and knitr).